
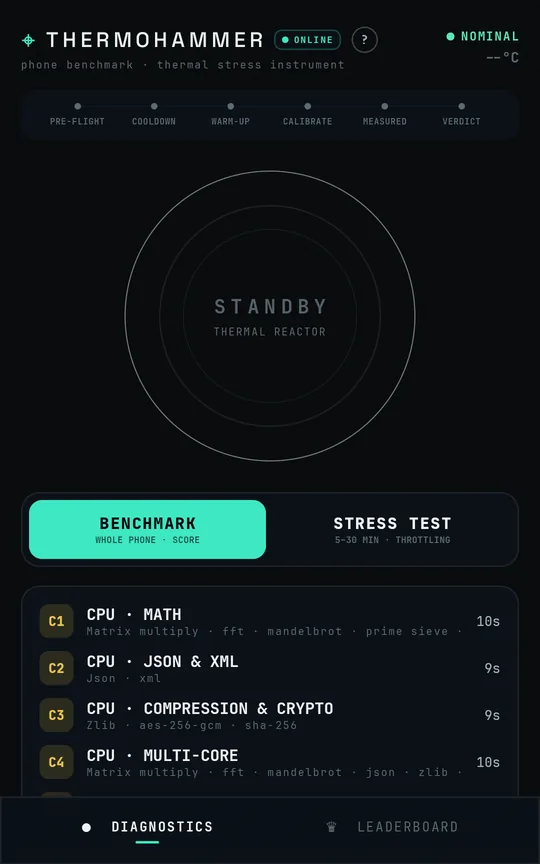
CPU
Raw processor work on one core, then on all of them.
- C1Math
- C2JSON & XML
- C3Compression & crypto
- C4Multi-core
Phone benchmark · thermal throttling test
ThermoHammer scores the whole device across six sections, then keeps the load on until it throttles. You see exactly when that happens, and how much speed is left.
Free · no account · no ads · see the leaderboard
01The benchmark
Every test is scored against the same reference: a Snapdragon 8 Elite phone, as it ships, is 6,000 points per section. Twice the points means about twice the measured speed. Add the six up and you have the total.
Raw processor work on one core, then on all of them.
How fast data moves: in RAM, on storage, and through a database.
Three real-time 3D scenes, rendered off the leash.
The things you actually do all day, measured instead of guessed.
Six open models, each on the CPU, the GPU and the NPU.
A language model running on the device itself.
02The stress test
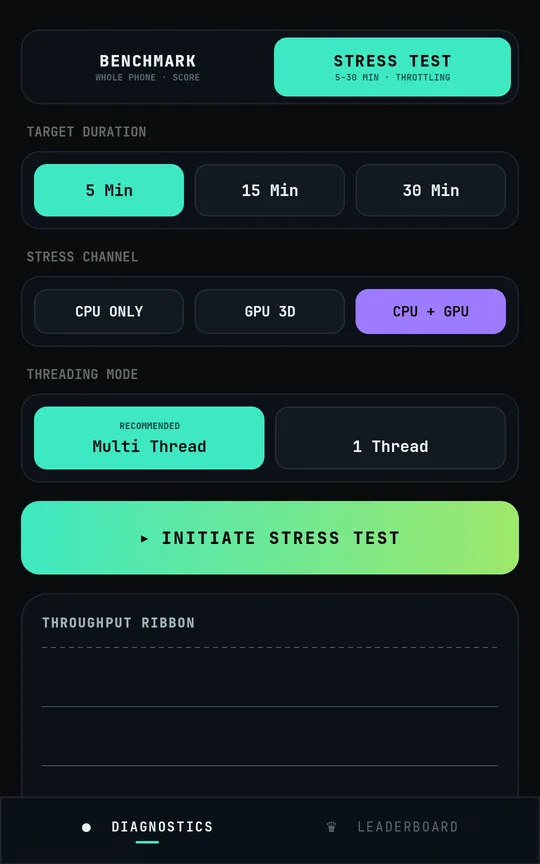
Most benchmarks stop before the heat arrives. Pick 5, 15 or 30 minutes, and ThermoHammer cools the device down, measures what it can do at full speed, then holds full load and records the throughput the whole way.
You get one number, stability: the share of its full speed the device actually delivered. And you get the curve behind it, with the moment each thermal warning appeared.
03Why the numbers hold up
The app sends its raw measurements with a signature. Points are calculated on our server, so a modified app can't hand itself a better score.
Started cool, unplugged, no power saving, nothing else busy. A run that misses any of those stays on your device and off the board.
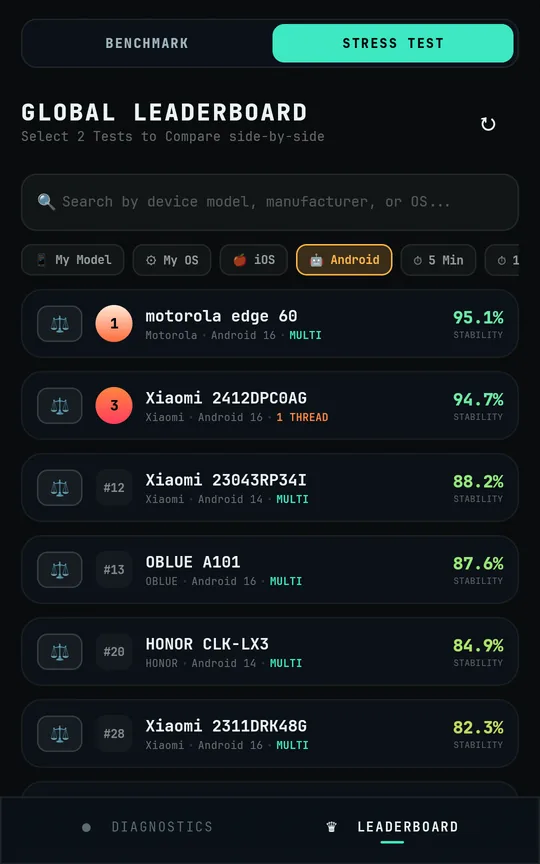
The board shows each model's best verified run and how many runs stand behind it. Open any row for every number of every test.
04Live leaderboard
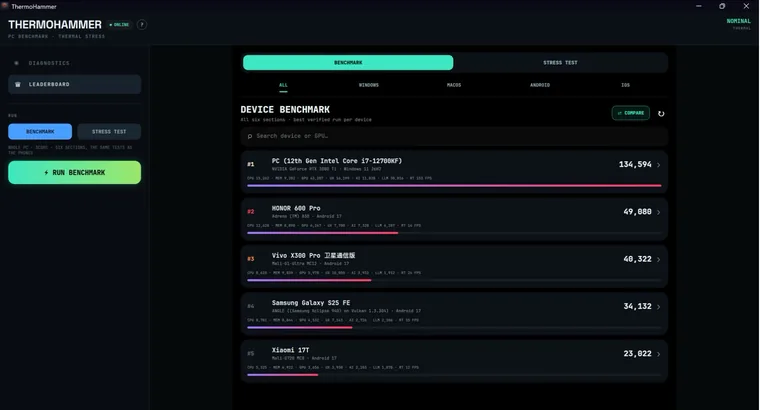
Phones and PCs on one scale. Data last changed .
05Compare
Put any two devices side by side: total, six sections, every single test, and how each one holds up under load. Every comparison has its own link, made to be sent.
06The apps
The same tests and the same scoring on Android and iPhone, with Windows PCs on the same board.
07Questions
Yes. It is free on Google Play and the App Store, with no account and no ads.
Yes. The test runs ordinary calculations and rendering at full load, the kind of work a long game or a video export does. The operating system stays in charge of every temperature limit; ThermoHammer only measures what the device does to protect itself. It will get warm, which is the point, and you can stop at any time.
Each of the six sections is scored against one reference: a Snapdragon 8 Elite phone, as it ships, gets 6,000 points per section and 36,000 in total. A section score of 12,000 means about twice that phone's measured speed in that section. The total is the six sections added up.
The share of its full speed a device delivers over a sustained, full-load run. 95% means it barely slowed down. 50% means half of the speed was gone.
Giga-instructions per second: billions of instructions the processor completes each second. It is the unit of the stress test's throughput curve.
Only verified runs are listed: the device started cool, was unplugged, was not in a power-saving mode and had nothing else keeping it busy. A run that cannot be sent is saved on the device so you can submit it later. The board shows each device's best verified run.
Android phones and tablets (Android 7 and later) and iPhone and iPad (iOS 16 and later) run the same tests and share one leaderboard. Windows PCs appear on the same board, labelled Windows; the Windows app is on its way to the Microsoft Store.
No name, no email, no account. Submitting a result sends the measurements, the device model, its chip and its OS version to the leaderboard, and that is what you see on this site.
Power mode, temperature, an OS update or a busy background can each move a score, sometimes a lot. The board keeps the best verified run per model; in the app, Phone Health compares your runs with other units of the same model and with your own earlier runs.
Free on Google Play and the App Store. Run it, submit a clean run, and your device joins the board.